The PDQ Connect team is excited to announce our latest new feature: reports.
With this new feature, you can report on all devices in your environment (no filter required) and create custom reports, such as all installed software and hardware.
Custom reports quickly deliver the results you need.
How to create, refresh, and share reports
Create a custom report by selecting columns you’d like to display. Optionally, you may also target a specific device group in your environment to limit your report to, and you can “group by” selected column data. “Group by” makes reports easy to scan, so you can effortlessly understand more about your environment.
We kept both of these functions — group targeting and the “group by” functionality — optional. That means you can create a full, flat report if desired, export it, and manipulate it to your liking in Excel or another tool outside of Connect.
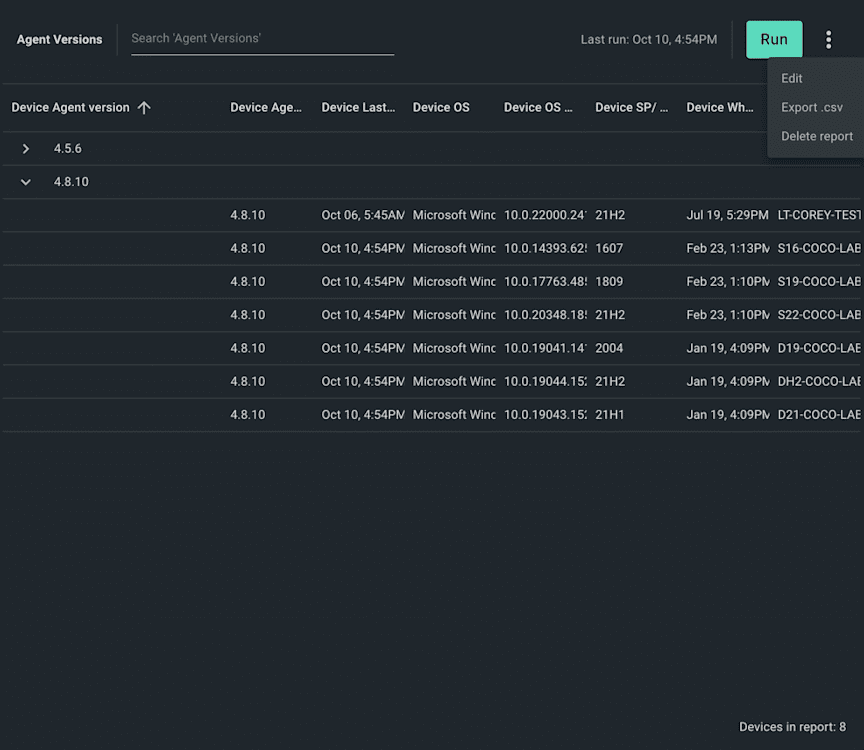
Saved reports reflect data from their initial creation or prior run. Click the Run button to refresh the data in a report. Did a colleague request your report? Export it as a .CSV to share it and collaborate with other teams.
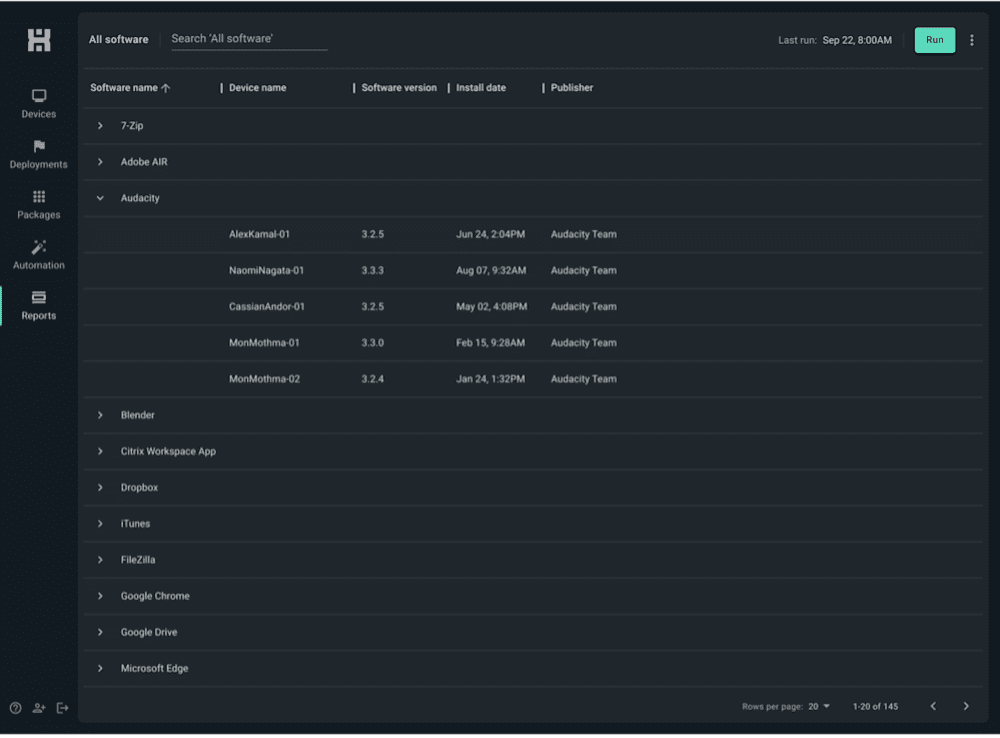
Here are two examples of reports you can create in Connect. For more information on how to create each of these, check out this article in our Knowledge Base.
Software inventory report

PDQ Connect agent version report

Did you know?
Every table view in Connect can be filtered, and its columns can be hidden/shown. You can also export the view as a .CSV file.
Ready to get full visibility into your environment? Want to ensure your machines are secure and up to date, whether they’re on prem or remote? Give PDQ Connect a whirl with a free trial.


